Automated 3D Spatial Scanner
Overview
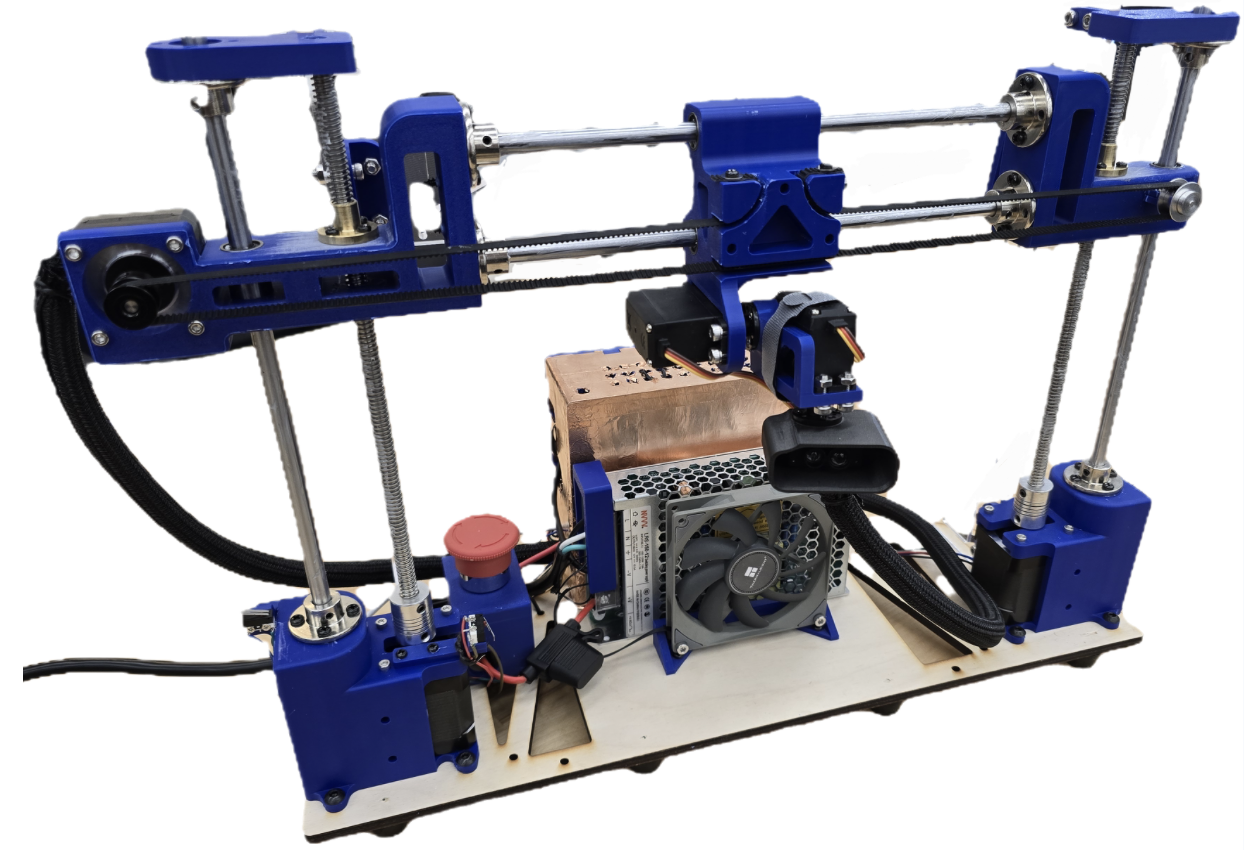
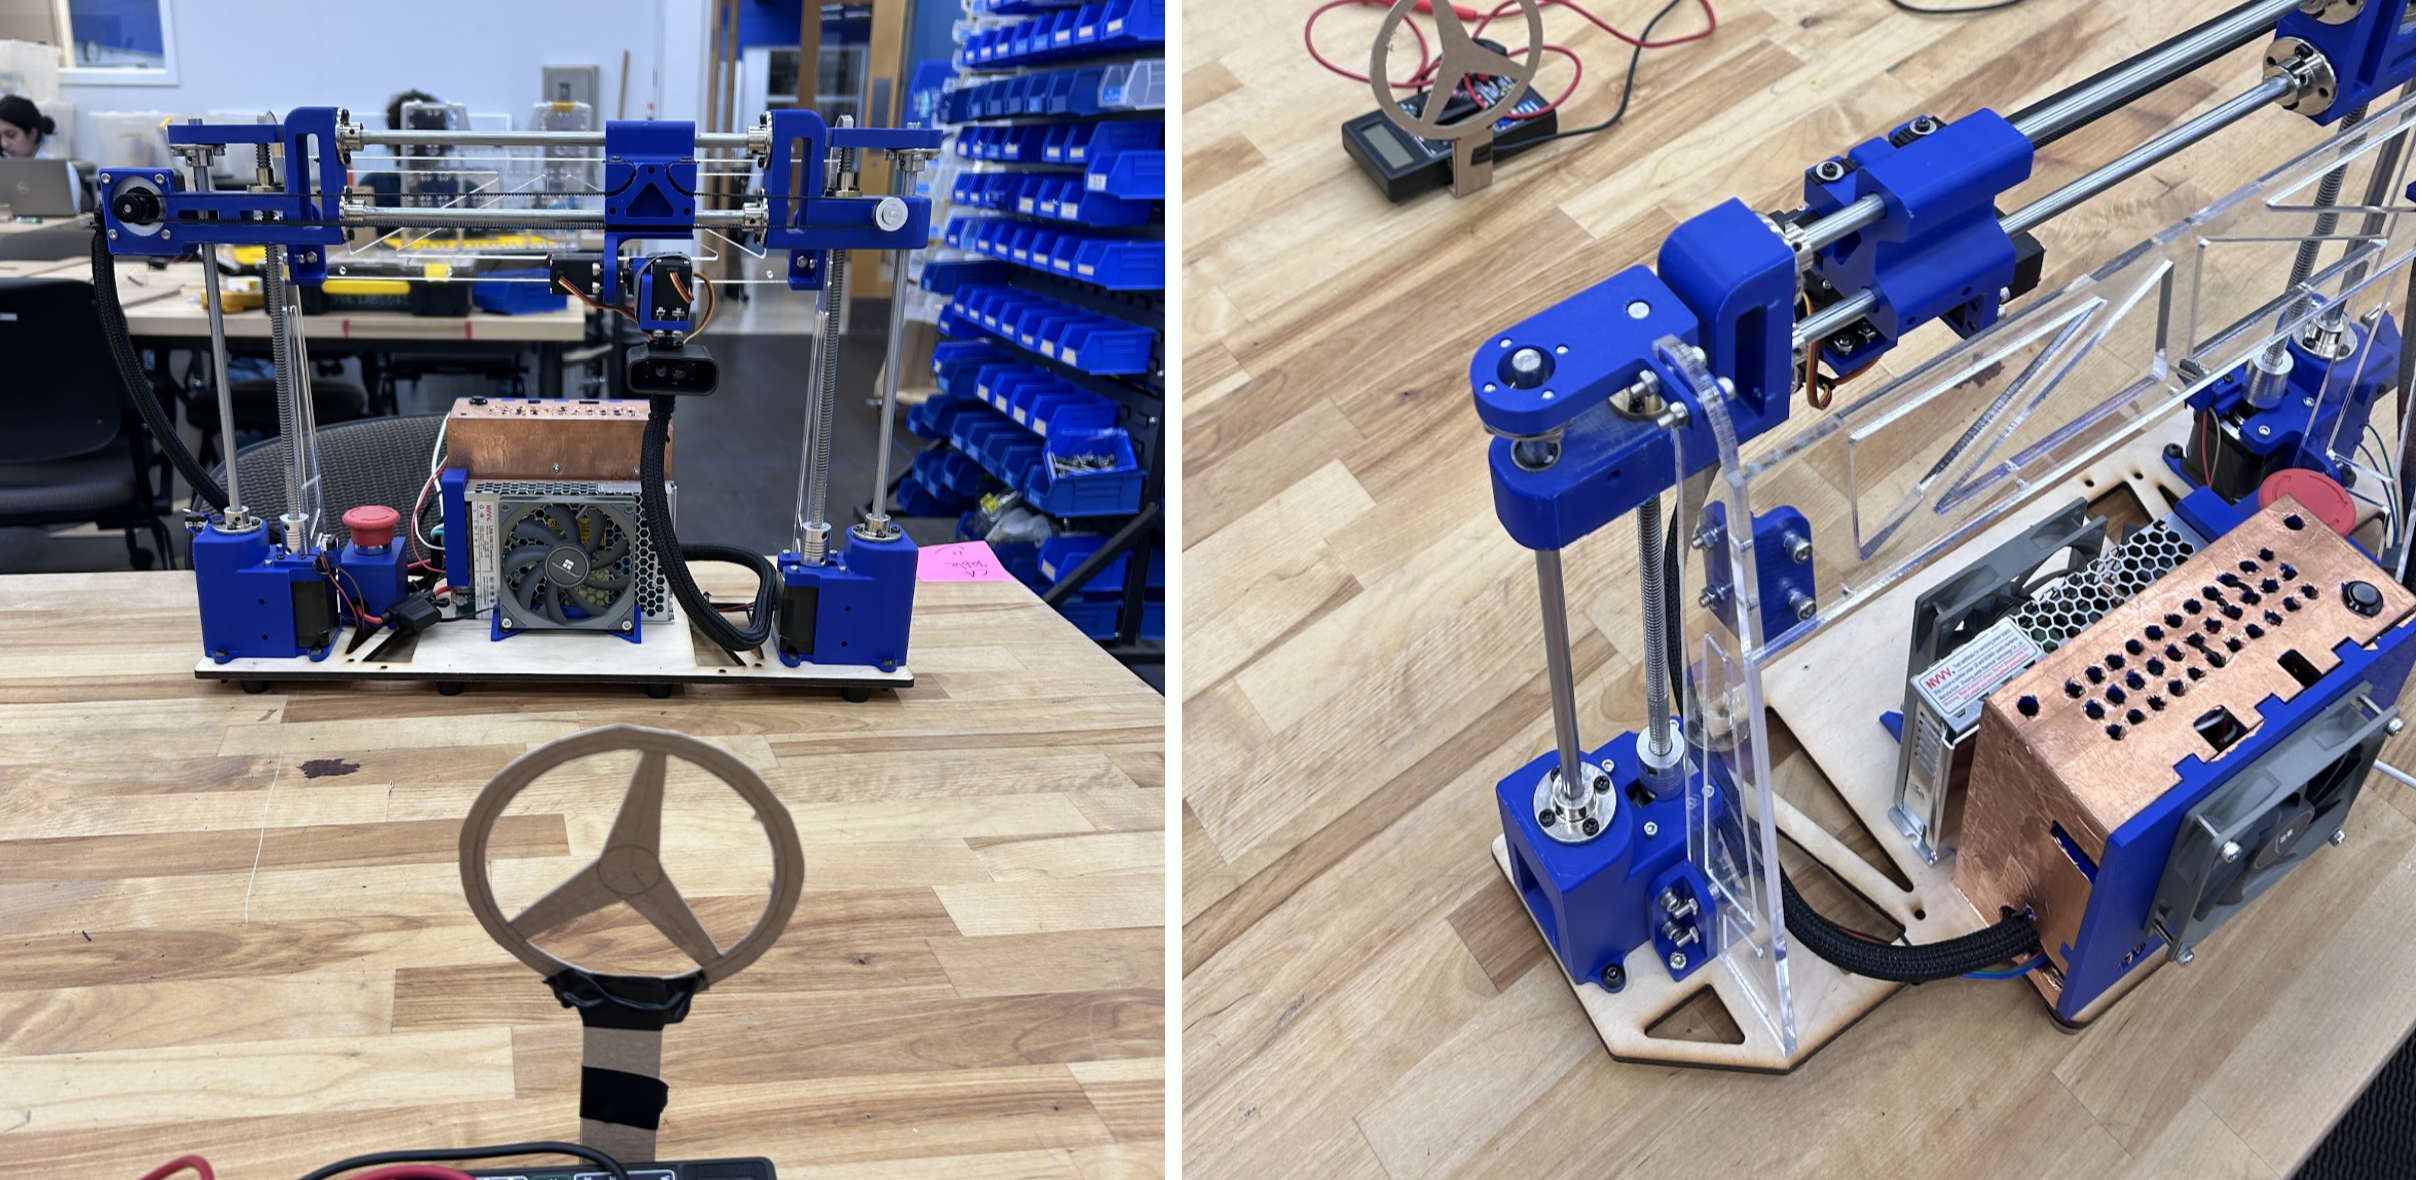
This project focused on building a custom 3D scanner capable of capturing the physical geometry of objects and rendering them as interactive 3D plots. The system used a TFmini-S LiDAR sensor mounted to a motorized mechanism to scan objects in a controlled grid pattern, gradually building a high-resolution digital outline from the collected distance data.
My Role & The Tech Stack
- Hardware: Arduino Nano, TFmini-S LiDAR, Servos, Stepper Motors
- Software: C (Arduino), Python (PySerial, NumPy, SciPy, Matplotlib), MATLAB
- Skills: Hardware Calibration, Serial Communication, Gaussian Smoothing, Data Visualization
The Engineering Process
Team Division: I was responsible for the software architecture, servo control logic, and data visualization, while my partner (Kefan Wu) led the physical mechanical design and assembly.
1. Hardware Control & Data Streaming
The LiDAR sensor precisely moved across a coordinate grid. I programmed an Arduino Nano to control the servos, shifting the sensor to specific X and Y positions. At specified points, the Arduino triggered the TFmini-S to capture the Z-distance, packaged the coordinate data, and streamed it over a UART serial connection to a connected computer.
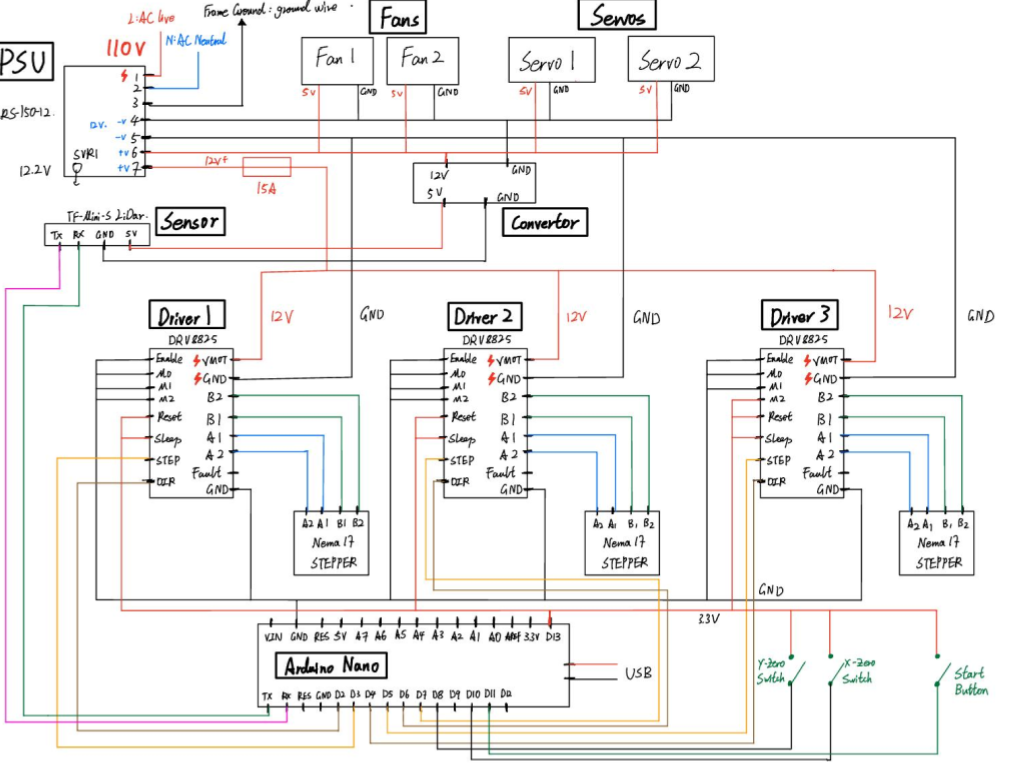 Caption: Electrical Block Diagram showing the wiring for the system.
I also created a homing sequence for ensuring that the X and Y values are accurate to the lidars position. We used two limit switches to find a new zero everything the program starts up. Caption: First successful homing sequence.
2. LiDAR Calibration & Error Correction
According to its datasheet, the TFmini-S should not require external calibration. However, during initial testing with a physical ruler and target boards, we saw measurement drift.
We recorded a series of reference distances and plotted them against the raw sensor outputs in MATLAB. By analyzing this data, we found a linear correction equation to adjust the incoming hardware data on the fly, significantly increasing the spatial accuracy of our final scans.
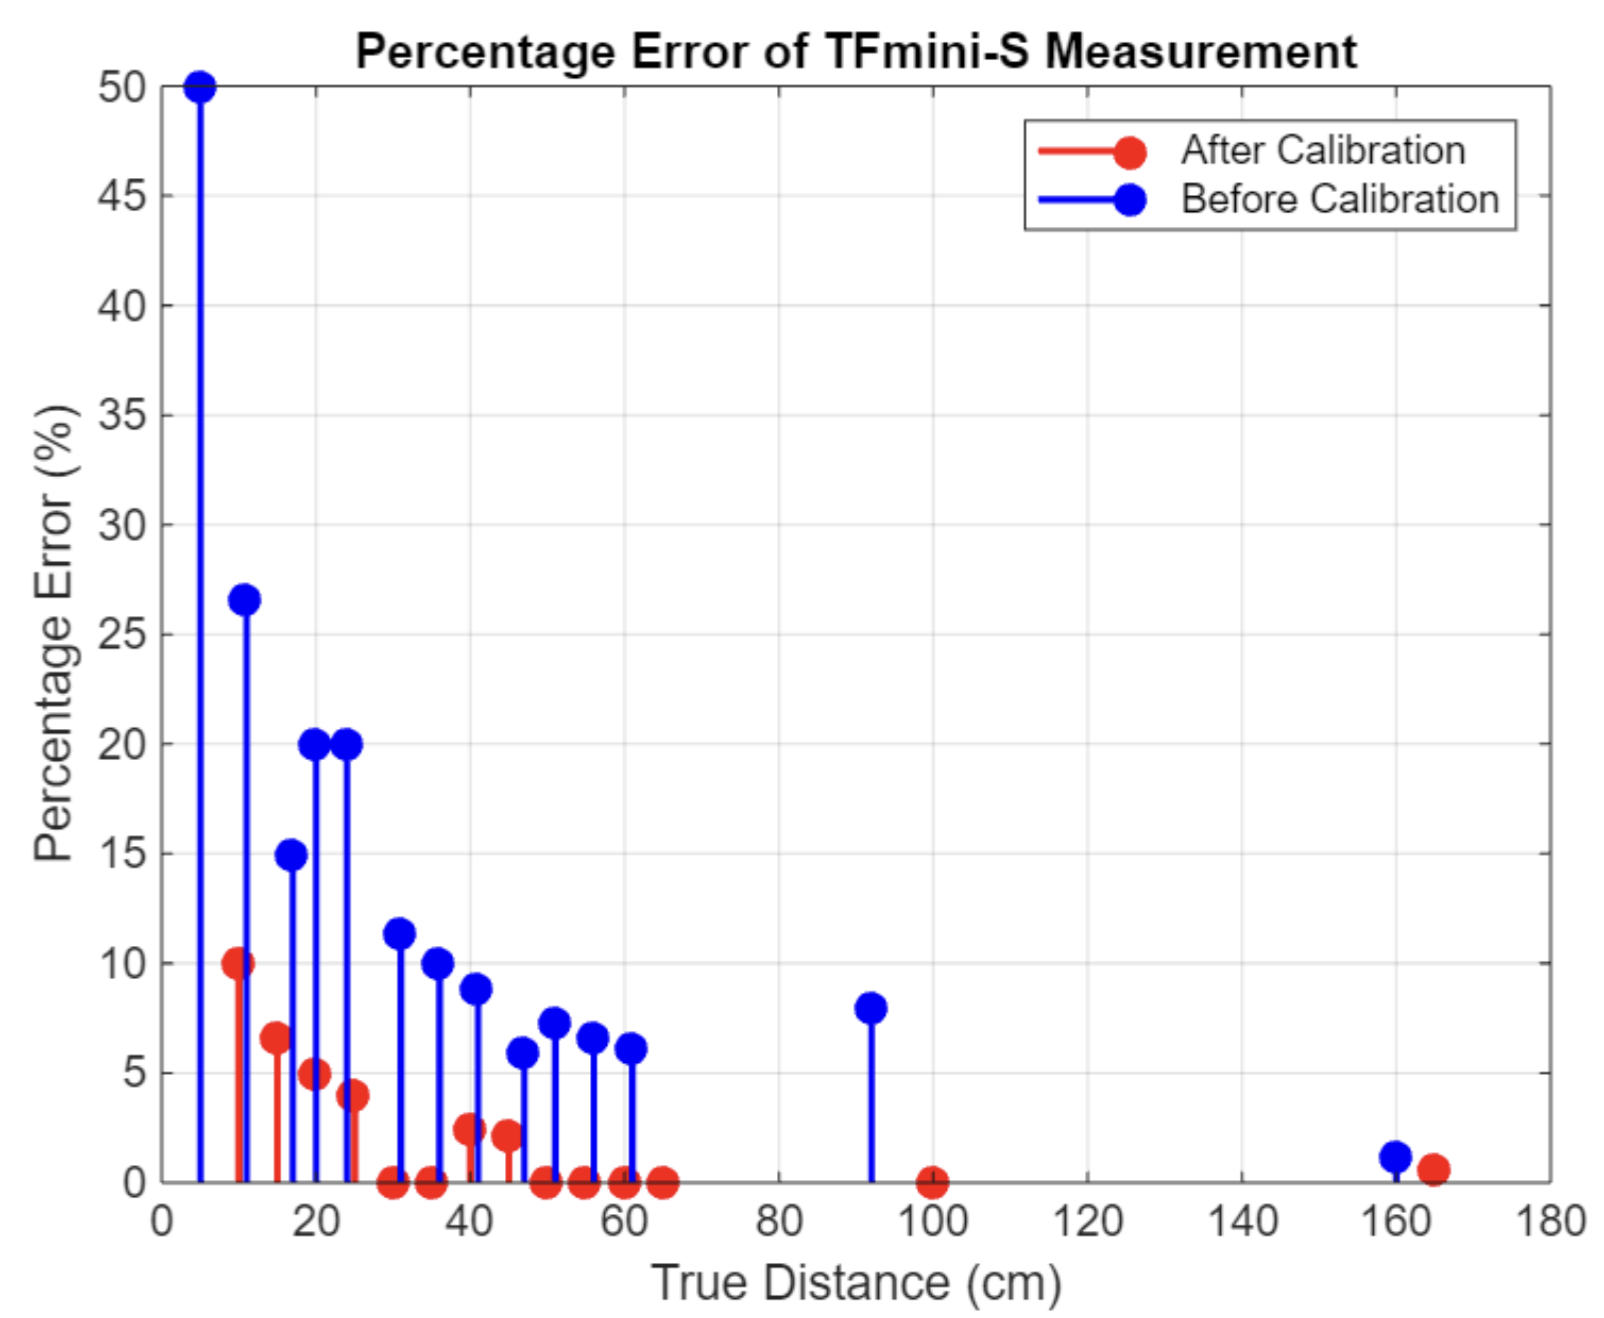 Caption: Graph Representing improvement with calibration.
3. Data Processing & 3D Visualization
Raw LiDAR scans are noisy. To turn the scattered point cloud into a readable model, I created a data processing pipeline in Python:
- Ingestion: Utilized
pyserialto capture the live stream of coordinates from the Arduino. - Interpolation: Applied SciPy’s
griddatawith cubic interpolation to fill in missing gaps between the scanned data points. - Smoothing & Rendering: Passed the gridded data through a Gaussian filter to eliminate hardware noise, finally rendering a clean, interactive 3D surface plot using
matplotlib.
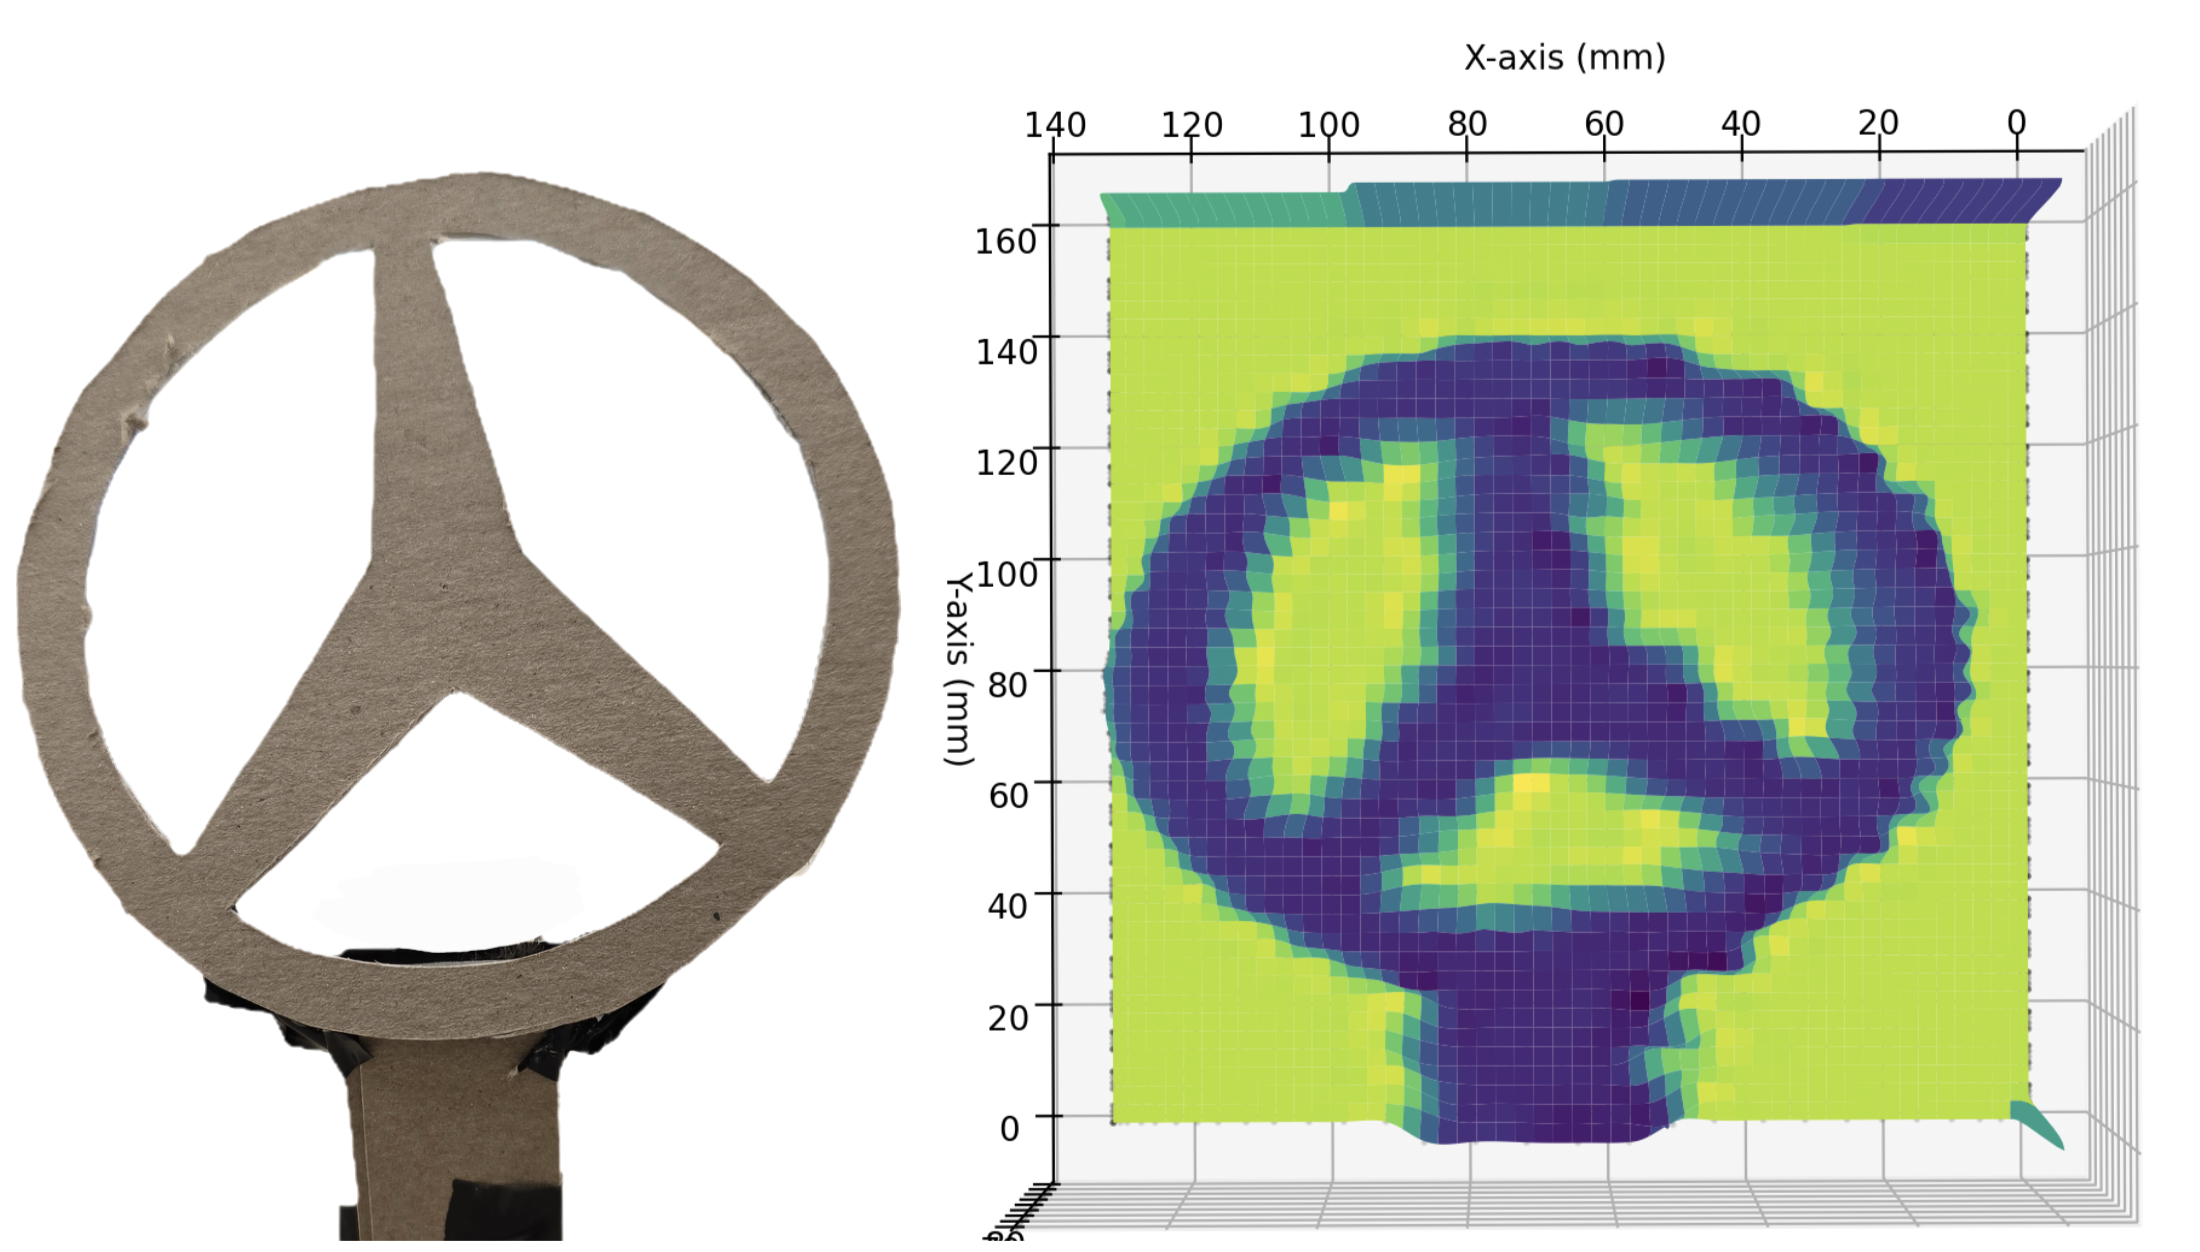 Caption: Side by side of actual image and modeled image
Project Links & Documentation
To read a detailed breakdown of our calibration math, hardware setup, and the complete Python rendering scripts, you can view the full project report below.
 Caption: The setup for scaning an object